Grafana Dashboard for Pgbouncer And Monitor With Percona PMM
Pgbouncer a connection pooler application that is widely used in any PostgreSQL environment. It's very lightweight but handles tons of connections. In the SRE world, now observability is playing an important role. This cool pgbouncer has some inbuilt tables(or views) to view the current status and historical stats. But it’s very difficult to run the commands via psql prompt And if we are thinking of setup monitoring then we need to put more effort to build such monitoring tools specifically for pgbouncer. Most of you heard of the Percona PMM monitoring tool. An opensource monitoring tool for MySQL, PostgreSQL, and MongoDB. Recently we migrated a PostgreSQL environment to CloudSQL and implemented the Percona PMM for deep monitoring.
During the load test phase we ran into some issues with PostgreSQL connectivity. But unfortunately, proper monitoring solution was not available for pgbouncer and we had tough time triangulating issues. When we were thinking to implement the monitoring for the pgbouncer, we decided that it has to be integrated with the existing monitoring tool, so we can track everything in one place. But PMM doesn’t have a native agent for pgbouncer. So we started checking a similar agent and we ended up with two open-source Prometheus exporters for pgbouncer.
The one from the Prometheus community is recently developed and has a less number of metrics. But the other one has many metrics and we have chosen that one for our production use case.
Again 2 more questions:
- How can we integrate with PMM?
- Where is the Grafana dashboard?
External Service:
One of the cool things with Percona PMM is its support for external services. As long as you have data in Prometheus, it can can be exported to a PMM server. We have already implemented this for Cassandra monitoring. So it’s not difficult to send the pgbouncer metrics to PMM.
Grafana Dashboard:
We got lucky with the exporter, but the dashboard needs to be built on our own 😂. So we went ahead and did just that — built a Grafana dashboard for pgbouncer (It’s open source, feel free to use and improve it)
Install the pgbouncer Prometheus exporter:
apt install python3-pip
apt install jq
sudo apt-get install libpq-dev
pip3 install prometheus-pgbouncer-exporter
There is a small issue in this exporter with Python 3.8 compatibility. So you have to replace the line number 47 on the file cli.py with the following line.

Now lets make the config file.
Replace
myadmin-userwith the pgbouncer admin user. And we are adding an extra-label callednode_ipthis exporter will not push the IP address of the pgbouncer node, so this flag will manually add the IP address into the metrics. And its important — Our grafana dashboard uses IP address to fetch metrics.
mkdir /opt/pgexporter/
cd /opt/pgexporter/vi config.ymlexporter_host: 0.0.0.0
exporter_port: 9100
pgbouncers:
  -
    dsn: postgresql://myadmin-user:$(PGBOUNCER_PASS)@127.0.0.1:6432/pgbouncer
    connect_timeout: 5
    include_databases:
    exclude_databases:
      - pgbouncer
    extra_labels:
      node_ip: $(PGBOUNCER_IP)
Create a systemctl file the pgbouncer.
Please replace
PGBOUNCER_PASS=strong-pgbouncer-passwordwith your pgbouncer admin user’s password.
vi /usr/lib/systemd/system/pgbouncer-exporter.service[Unit]
Description=pgbouncer prometheus exporter[Service]
User=root
WorkingDirectory=/opt/pgexporter
Environment="PGBOUNCER_PASS=strong-pgbouncer-password"
ExecStartPre=/bin/bash -c "/bin/systemctl set-environment PGBOUNCER_IP=$(ip -json addr show $interface |   jq -r '.[] | .addr_info[] | select(.family == \"inet\") | .local'| grep -v '127.0.0.1')"
ExecStart=pgbouncer-exporter --config ./config.yml
Restart=always[Install]
WantedBy=multi-user.target
Lets start the pgbouncer exporter service.
sudo systemctl enable pgbouncer-exporter.service
systemctl daemon-reload
sudo systemctl start pgbouncer-exporter
sudo systemctl status pgbouncer-exporter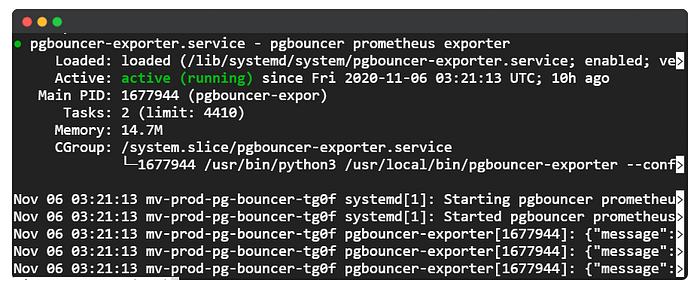
Install the PMM Client:
We are using Ubuntu, if you want to install it on another distribution then refer this link.
wget https://repo.percona.com/apt/percona-release_latest.generic_all.deb
sudo dpkg -i percona-release_latest.generic_all.deb
sudo apt-get update
sudo apt-get install pmm2-client
Add the pgbouncer to the PMM server.[Refer to this link to configure the PMM server]
-- We giving the service name with the IP as suffix to run the below command to pass IP into PGBOUNCER_IP variablePGBOUNCER_IP=$(ip -json addr show $interface | jq -r '.[] | .addr_info[] | select(.family == "inet") | .local'| grep -v '127.0.0.1')pmm-admin config --server-insecure-tls --server-url=https://admin:grafana-password@10.10.10.8:443pmm-admin add external --service-name=pgbouncer_$PGBOUNCER_IP --listen-port=9100 --metrics-path=/metrics --scheme=http
Make sure that PMM client needs to talk to PMM server on port 443 and PMM server needs to collect the metrics from the PMM client via port 9100. So make your firewall rules accordingly.
Now lets check the status.
pmm-admin list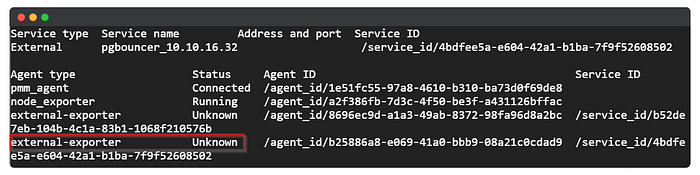
But the status is unknown. This is strange, so I raised a question to the Percona team, and here is their response.
Status unknown is expected because we don’t really know is the exporter OK or not because it’s our of PMM agent control
So this is expected. Ok, then how to we make sure its really up?
- Do curl on pgbouncer to check whether the agent is collecting the metrics or not.
curl localhost:9100/metrics | grep pgbouncer_up# HELP pgbouncer_up PgBouncer is UP and the scraping of all metrics succeeded
# TYPE pgbouncer_up gauge
pgbouncer_up{node_ip="10.10.16.32"} 1.0
2. Go to the Advance Data exporter dashboard in PMM and see the same metric is available or not.
Finally, the metrics are exported to PMM. Now lets import the dashboard. We have open-sourced this dashboard and you can get it from the Grafana website.
NOTE: We have used
node_ipto filter the metric, if you are not using it then you can replace thenode_ipwithnode_namein the JSON file. Also, node_name will be useful to see stats like uptime, cpu, and memory consumption, so you have to select the value separately along with the Host parameter.
Dashboard:


Conclusion:
The advantage of using this exporter is, it be installed anywhere. Also in one config file, we can monitor multiple pgbouncer instances.(but make sure you are going to add node_ip as a extra flag). Percona PMM has a dashboard and the metric collector agent for ProxySQL(one of the best connection poolers with a lot more options). But pgbouncer also widely used and trusted by the PostgreSQL community. So it would be great if the Percona team will publish the metric collector and dashboard with PMM.